
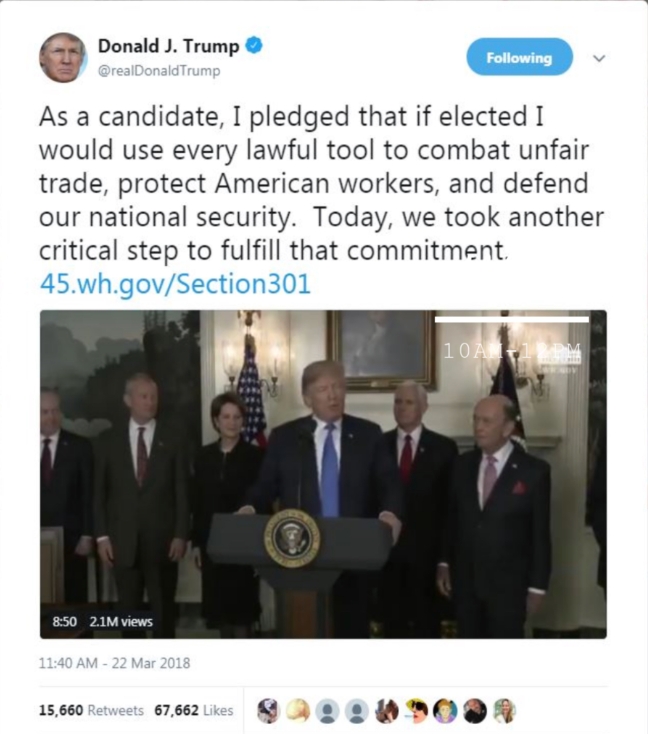
The use of social media facilitated people’s accessibility to the political incident. And especially, social media played a predominant role when people express their opinions towards an influential event. According to New York Times, on March 22, President Trump declared a new tariff policy towards Chinese imports via Twitter, which could impact American economy and Sino-US trade relations a lot. Immediately, Twitter users gave attention to this policy and began to discuss it. To find out what Twitter users talked about this policy, I collected the tweets from March 21 to 25 (but not consecutive due to technical problems) and try to analyze the information diffusion pattern among users by data visualization.
Literature Review
Based on selective exposure theory and homophily principle (Monge,2003), some researchers argued that technical progress may lead to people only select information which reinforced their pre-existing views but avoid the conflicting information when people engaging in discussion of political event online. As a result, the online political communication became a political polarized exchange, and thus formed an echo chamber where the ideas reinforced by repeated release and reception inside an “enclosed” system. However, Barberá, P., Jost, J., Nagler, J., Tucker, J., & Bonneau, R. (2015) found the polarization level of online communication on social media varied regarding to different topics. By collecting data of 3.8 million Twitter users with nearly 150 million tweets, they investigated the degree of ideological polarization in social media usage. With regard to the governmental issues, the polarization level was the highest. But for non-political topics, the cross-ideological communication was found. From Oscar to 2012 Election, the polarization level increased gradually. Garrett (2009) also stated that the effect of neglecting opinion-challenging information is small and people won’t isolate themselves from others entirely.
Given that this incident was a political issue and induced some controversy, so I hypothesized the online communication tended to be a polarization and resembled echo chamber. And also I want to find out what Twitter users talked about and the information diffusion pattern.
Methodology
The tweets were collected by TAGS 6.1. Since people didn’t use hashtag when they engaged in the discussion necessarily, I decided to use the key word china AND (tariffs OR #tariffs) instead of the hashtag trade war. And to avoid missing the key account, Donald Trump, I also included his account name. The final term used to collect data was china AND (tariffs OR #tariffs) OR (@realDonaldTrump AND trade).
The raw dataset has 68,362 tweets in total. The content analysis was conducted on a random sample, after sampling every 150th tweet from the population, there were 454 tweets. After excluding tweets in other language or irrelevant, there are 387 tweets remaining in the sample. The visualization of information diffusion was based on a retweet database of 46,821 tweets sent by 39,241 users.
Result of Analysis
Overview
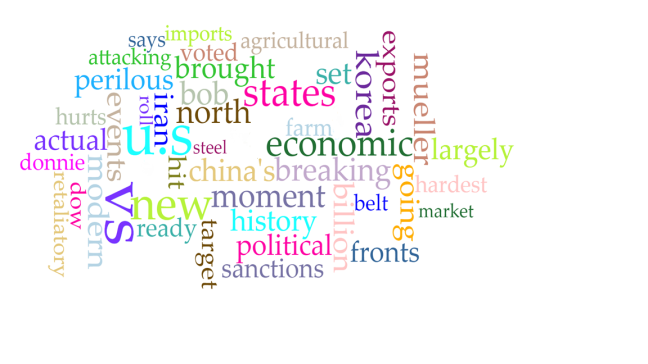
I upload the content of all the tweets to the Voyant to explore the key words of what people talked about.
After filtering the most prominent topic words, such as China, Trade, Tariffs, and Trump, here we got some key words salient among all tweets. Breaking, sanctions, imports, exports, hurts, retaliatory, attacking, agricultural, perilous, hardest, economic were the most prevalent.
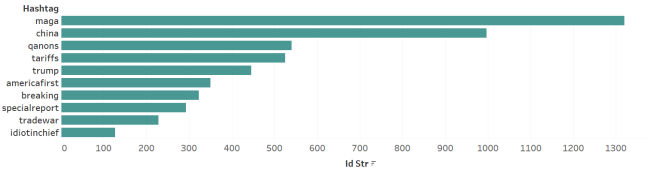
The dataset was not collected by hashtag, so I’m interested that how people used hashtag when they discussed this incident. From this graph, we could know that the most used hashtag was #maga (make American great again), but there were only 1320 (less than 2% of all the tweets) tweets had this hashtag. So I tend to imply that most people didn’t use any hashtag when they talked about this new policy.
People’s Attitude toward the policy:
The analysis was based on the sample of 387 tweets. Two variables were set (see Appendix for the coding scheme): people’s attitude and whether the tweets mentioned any influence of this policy. And the results are as follows:
| People’s Attitudes | ||
| Negative | 163 | 0.42 |
| Neutral | 179 | 0.46 |
| Positive | 45 | 0.12 |
From this graph, we could know that only 12% of people held positive attitudes towards Trump’s policy, and nearly 90% of people were opposed or kept neutral to the policy.
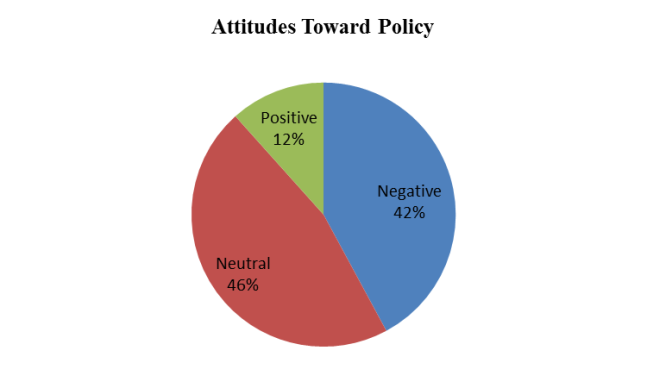
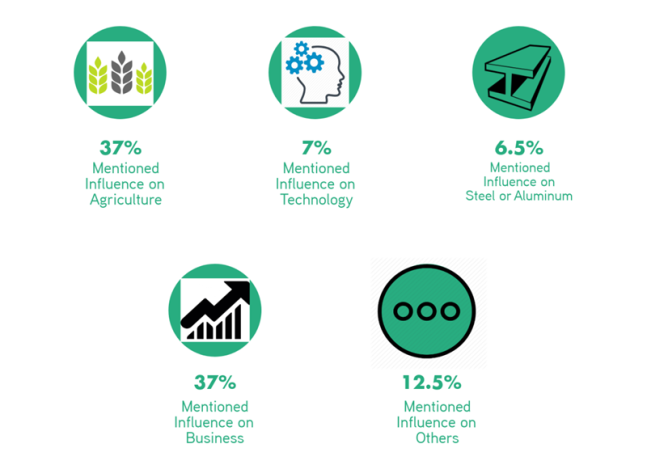
And 152 tweets (39.28%) in the sample mentioned this policy’s influence. More than 70% of the tweets mentioned about the policy’s negative influence on agriculture and business.
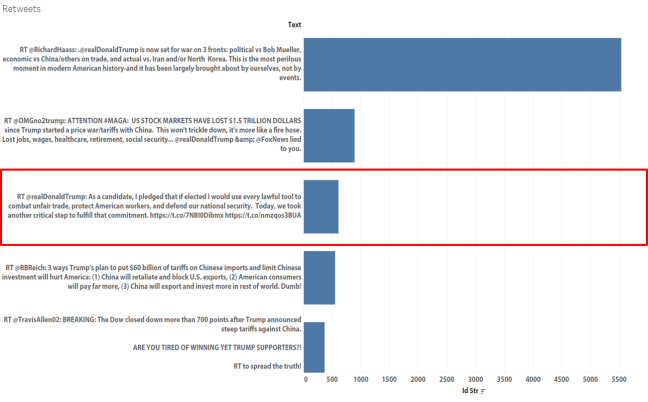
 The visualization of Tableau was based on 68,363 tweets collected. And there are the top 5 tweets retweeted most. According to the coding scheme, there is only one tweet (in red box) holding the positive attitude towards Trump’s policy among the top 5 tweets. And that was from Trump himself. The most retweeted one was from Richard N. Haass, the president of Council of Foreign Relations, and he depicted this new policy as trade war and claimed that it is one of the most perilous moments made by American per se. The second retweeted one was from OMGno2trump, a hater of Trump, and his tweet was about that US stock market has lost 1.5 trillion dollars because of Trump’s new policy. Most of his tweets were satirizing Trump and had large number of retweets even more than Trump who ranked 3 in this list. The tweet ranked 4 was also criticizing this policy that it would hurt America in 3 ways. And the last one emphasized that the stock market closed down 700 points because of the policy. So we could know that almost the most retweeted tweets were talked about the negative results of Trump’s new tariff policy.
What role did media play?
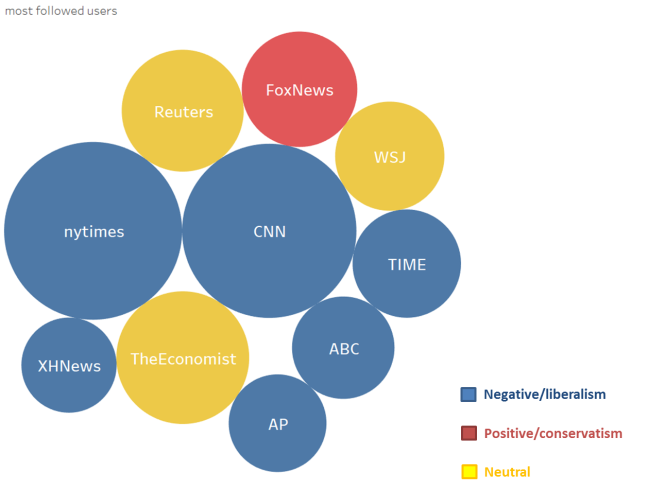
From this graph visualized by Tableau, we could know that the most followed users were all media accounts: New York Times, CNN, The Economist, Reuters, Fox news, The Wall Street Journal, Time, ABC, AP and XinHua news. They are not the most visible accounts but their large follower numbers make them influential. Based on their tweets regarding to this policy or their previous political inclination, I used three different colors to mark them. From the graph, we could know that the majority of media organization inclined to liberalism or held negative attitudes toward this policy.
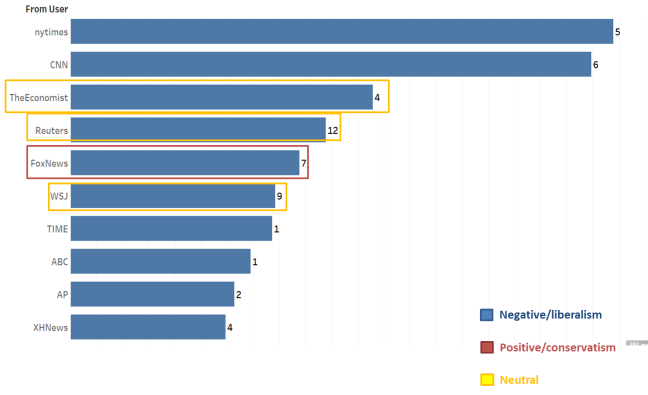
And we can also get to know how many tweets they contributed to the dataset from this graph. New York Times ranked the first on the list, and it contributed 5 tweets to the dataset. And the second one was CNN with 6 tweets.
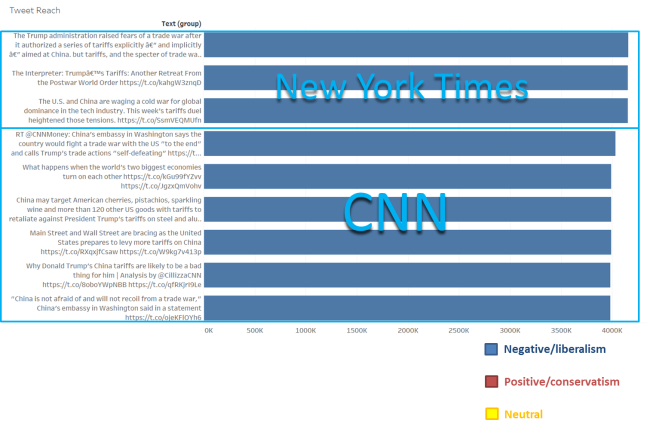
This graph showed the most influential tweets in the dataset. The x axis means these users’ tweets could reach how many people potentially. The tweets ranked in the top three were all form New York Times who contributed 5 tweets to the dataset in total. And the tweets ranked 4 to 9 were all from CNN. This graph showed us the great influence of media again.
How did the information flow?
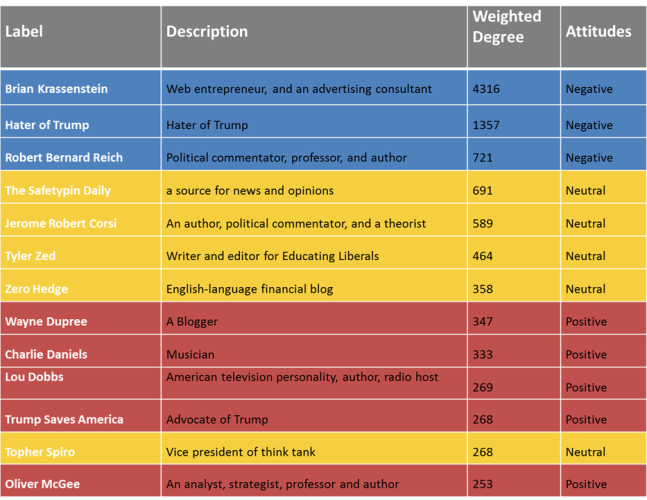
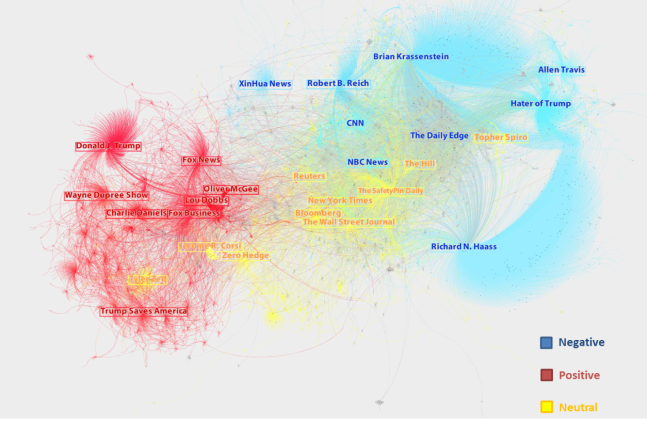
This graph was visualized based on retweet database by Gephi. I manually coded the top 27 users with high weighted degree based on their descriptions, and assigned the categories “politician”, “media organization” and “key opinion leader”. Purple represents politicians, yellow stands for KOLs and blue is for media organizations. Node size corresponds to their weighted degree. The bigger the nodes, the more retweet it had. And the closer the nodes, the more connections they share. From this graph, we could know the media organizations were in the central of the whole network, they disseminated information and lay acrossed the politicians and the KOLs. Compared to Richard Haass (the largest purple node), these blue nodes were not large in size, but still occupied an important position in the network. Again, we could know that media accounts played an important role. In the top 27 nodes with highest degree, there were 11 accounts of media institution. And the media institutions were all closely connected except XinHua News, a news agency from China, and Fox news, Fox Business, who inclined to the conservatism.
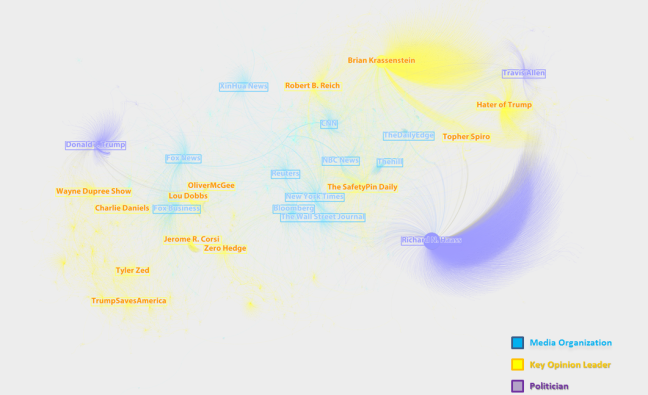
The KOLs almost accounted for half of the 27 nodes, and they dispersed in the left and right sides of this graph. It may derive from that they had different occupations and concentrated on different fields. Based on their attitudes toward the policy, I marked them by different colors. Red is for positive attitude, yellow for neutral, and blue for negative.
From this graph, we could know more KOLs adopted neutral or positive attitudes towards this policy. These KOLs provided this incident with diversified comments or opinions. However, the top 3 high weighted degree KOLs all held negative attitude.
Then I manually coded these top 27 users according to what their tweets’ attitude towards this policy, and marked them by different colors. From this graph, we could know the users holding the same attitude connected more closely and users holding different attitude tended to have little communication.
Discussion
Trump’s new policy resulted in many negative impacts on stock market and agricultural exports, and thus led to people’s opposition towards this policy. And there were also some advocates who supported Trump to make America great again via this tariff policy. Nevertheless people adopted positive attitude were retweeted less and had less influence. In the process of information diffusion, media accounts connected KOLs and politicians. Although users can get information from politicians and KOLs directly, media accounts played an important role still. From the graph of communication of people with opposite attitude, we could still get the pattern of echo chamber. That is, people tend to communicate with who held the similar opinion rather than who held the different opinion. Under this circumstance, people were like in an “enclosed” system where the same idea was reinforced by repeated again and again.
But there were still some limitations in the project. First of all, the data was collected not consecutively, which could lead to miss some important tweets and have some influence on the analysis result. In addition, the graph visualized by gephi premised that retweet was taken as message endorsement, which is not necessarily.
References
Barberá, P., Jost, J., Nagler, J., Tucker, J., & Bonneau, R. (2015). Tweeting From Left to Right. Psychological Science, 26(10), 1531-1542
Garrett, R. (2009). Echo chambers online?: Politically motivated selective exposure among Internet news users 1. Journal of Computer‐Mediated Communication, 14(2), 265-285.
Landler M. & Tankersley J. (2018, March 23). Trump hits china with stiff trade measures. New York Times, Retrieved April 20, 2018, from https://cn.nytimes.com/business/20180323/trump-will-hit-china-with-trade-measures-as-white-house-exempts-allies-from-tariffs/en-us/
Monge, P., & Contractor, N. (2003). Theories of communication networks. Oxford ; New York: Oxford University Press.
About the Author
The author is a MA student in Communication programme, HKBU.
E-mail: portisimon@gmail.com
Appendix
Coding Scheme
| Variables | Definition | Examples | |
| Attitudes toward Trump’s policy | 1 for negative | Emphasize the negative result;
Express negative emotions towards trump/policy directly |
A Trump trade war with China could hit these industries hardest |
| 2 for neutral | Not judging this policy as good or bad, only share information | Trump Is Said to Plan to Impose $50 Billion in China Tariffs | |
| 3 for positive | Emphasize the positive result;
Express support or positive emotion to Trump or the policy |
Nothing like a good trade war to get the economic juices flowing. | |
| Mentioned Influence On Which Area
|
0 for no | Didn’t mention any influence
|
well written piece:::Wall Street Journal Admits “China Started The Trade War, Not Trump” |
| 1 for agriculture | Mentioned influence on agriculture or farmer or exportation of pork, fruit and wine | @realDonaldTrump One day after you wrote this, China announced its plans to target farmers with their own tarrifs on response to your ill-advised tarrifs on steel and aluminum. Maybe you should walk back those tarrifs if you want to keep your base happy? | |
| 2 for technology | Mentioned influence on technology products or industry | RT @defeat_gop: Trump Tariffs on China Could Make Smartphones, Laptops, Bras and Sneakers More Expensive for Americans – Newsweek | |
| 3 for aluminum and steel | Mentioned influence on exportation of aluminum and steel | #China may hike tariffs on #US pork, aluminum, other goods https://t.co/7vYl5b0Q09 via @seattletimes #economy #politics #trade #tariffs #ports #shipping #workers #voters #Congress #2018Midterms #manufacturing | |
| 4 for business | Mentioned influence on stock market or economic | @POTUS. Not a genius, eh? Dow sheds more than 1,100 points in two days as trade jitters rock Wall Street | |
| 5 for others | Mentioned influence on other areas | RT @nathansnewman: China not messing around with zero-sum trade battles; it’s investing $1 trillion in infrastructure IN OTHER COUNTRIES to make trade with China easier.
US is letting our own infrastructure rot. 2017 is a good marker for when China replaced US as most important global power |
|
